Telemetry layer
Live data ingestion and normalisation
The platform ingests solar and load telemetry streams, cleanses data, and structures it for continuous analysis.
Case Study - AI Solar Operations
How an AI-driven solar operations platform unified telemetry, forecasting, and risk prioritisation for faster, more reliable energy decisions.
Client profile
Commercial energy operator with distributed solar assets
Use case
Performance optimisation and downtime prevention
Platform
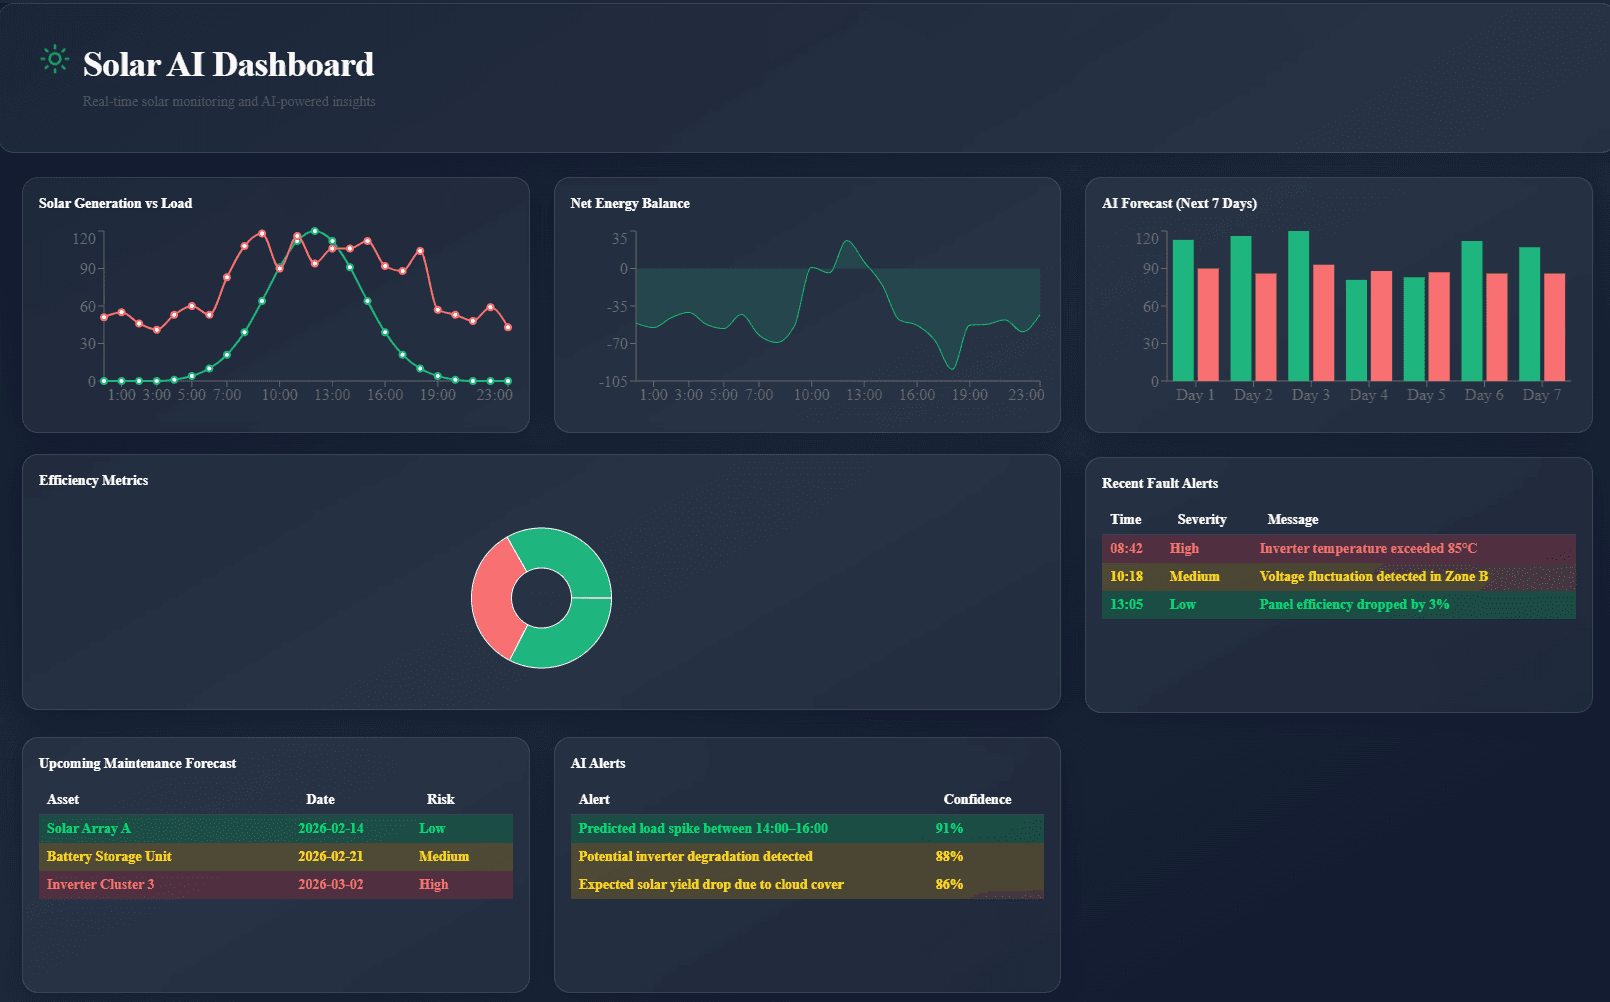
AI Solar Operations Dashboard
Status
Operational concept validated
01
The operating environment required real-time awareness across generation, load, and asset health. Existing workflows were reactive, and teams lacked a unified way to detect performance decline early and act before losses accumulated.
02
We designed a full operational intelligence layer spanning live telemetry, forecasting, anomaly detection, and role-specific decision support. The goal was to make every important signal visible and actionable in one interface.
Telemetry layer
The platform ingests solar and load telemetry streams, cleanses data, and structures it for continuous analysis.
KPI layer
Real-time metrics for generation, load, net energy, and efficiency are computed automatically for each asset.
Prediction layer
Machine learning models predict expected behaviour and flag deviations early before they become costly failures.
Decision layer
The system ranks issues by operational and financial impact to guide maintenance and response sequencing.
Visibility layer
Operations, maintenance, and leadership each receive the signals that matter to their decision context.
Deployment layer
The dashboard architecture is designed for rapid rollout across additional sites without full rebuild cycles.
03
The platform changed how teams operated daily by replacing fragmented hindsight with continuous, predictive visibility.
Before
Performance issues discovered after measurable energy loss
Fragmented reporting across spreadsheets and disconnected tools
Maintenance effort spread evenly instead of risk-prioritised
Leadership visibility delayed by manual reporting cycles
After
Continuous monitoring with early anomaly signals
Single source of truth for generation, load, and net energy
Priority-ranked intervention queue for maintenance teams
Decision-ready executive view with live operational context
04
Validation showed that combining live telemetry with predictive analytics can materially improve energy operations before full production expansion.
Anomalies were surfaced sooner, reducing the delay between issue emergence and response.
Teams moved from generic alerts to ranked actions with clear next steps.
Stakeholders gained a shared operational picture from one unified dashboard.
Forecast-backed insights improved planning and reduced reactive firefighting.
We are opening implementation tracks for operators who need stronger visibility, earlier fault detection, and better energy decision control.